Estimating the size of a market often involves more than demographic and geographic information. Does the market include people with certain psychographic (attitudes, values, beliefs and interests) or behaviouristic (habits, preferences, and purchasing patterns) characteristics? To find this information, the Statista, Mintel, and Vividata databases are often good places to search.
Each database has unique information, so searching in multiple databases is often recommended. You might not find the exact number of potential customers, so you may need to do some math. For example, take the data you may have found from Statistics Canada and data from Statista and Mintel to calculate an estimate.
15 STEPS
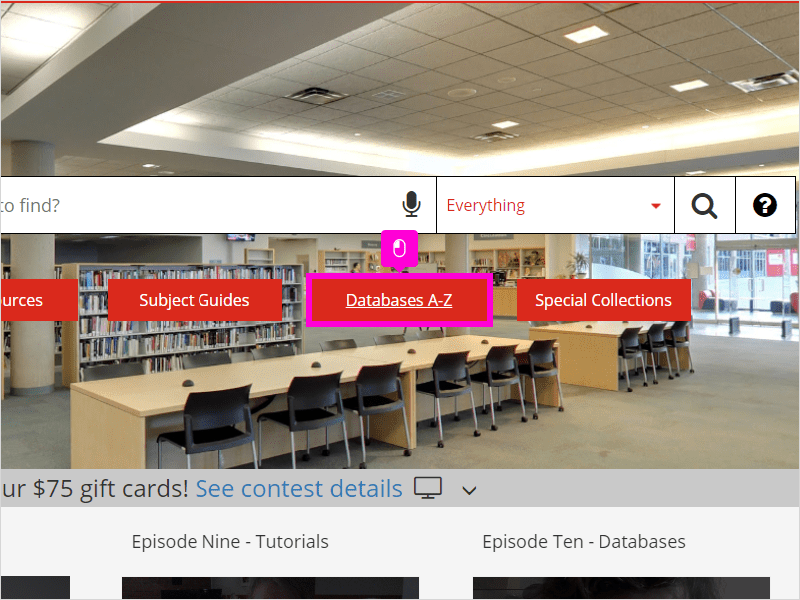
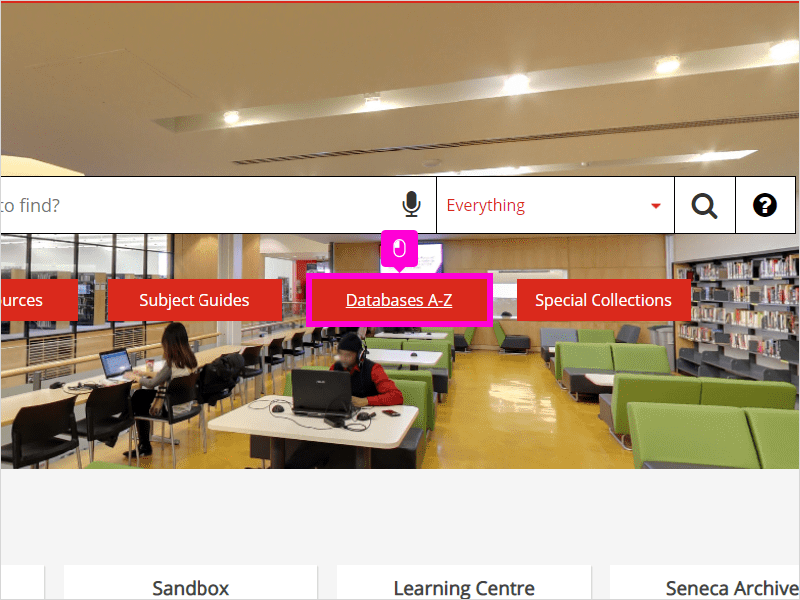
1. The first step is to open Seneca Libraries and click Databases A-Z
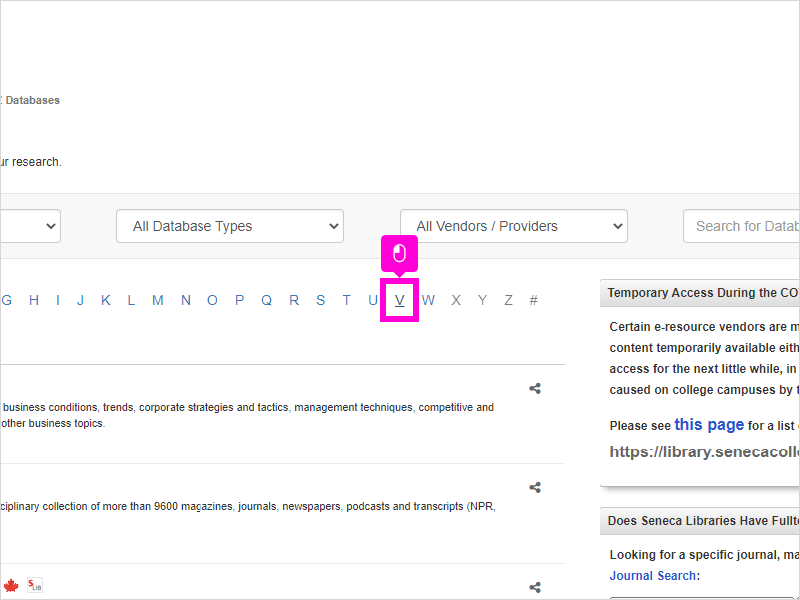
2. Click V.
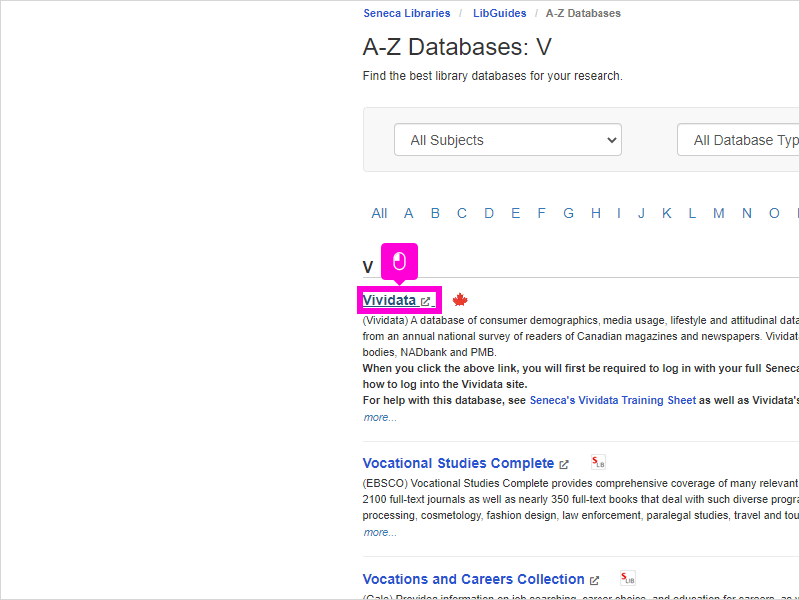
3. Click Vividata.
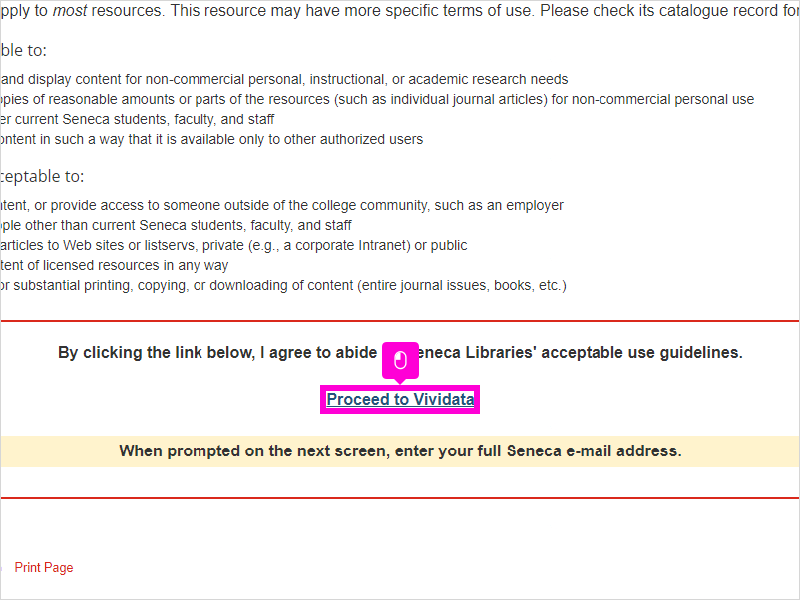
4. Click Proceed to Vividata.
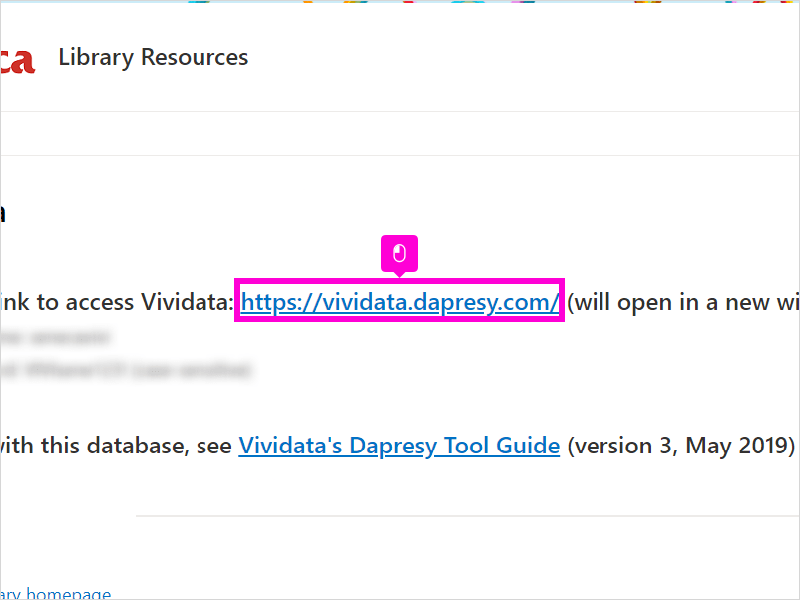
5. Click https://vividata.dapresy.com/.
Take note of the username and password as you will need these for the next screen.
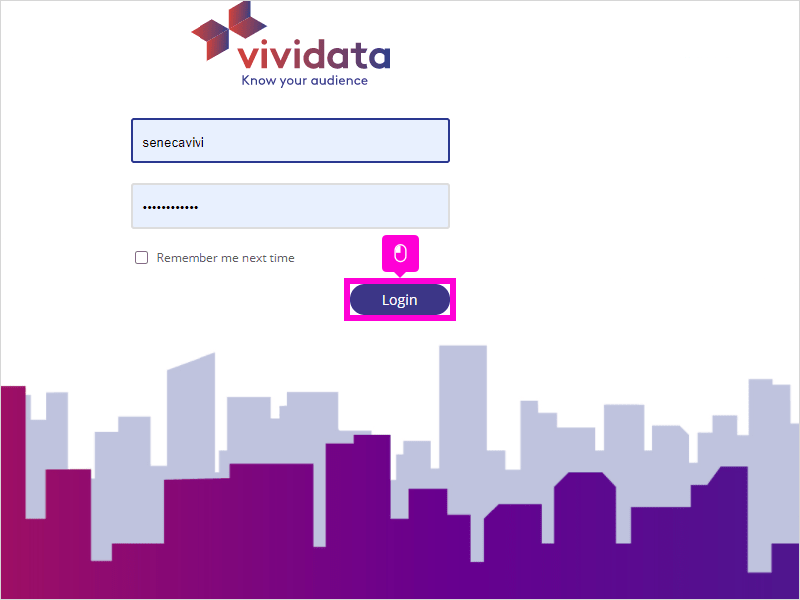
6. Enter the username and password from the previous screen and click Login.
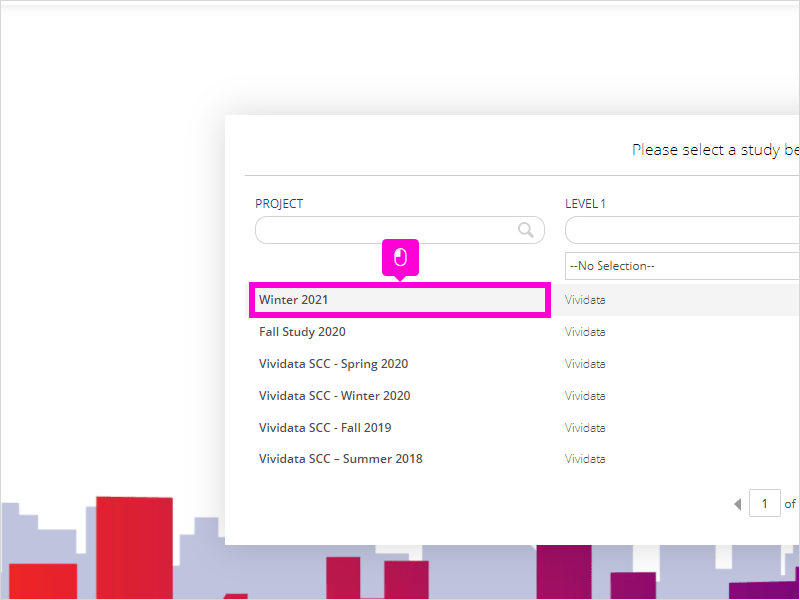
7. Click Winter 2021 or the most recent season listed if available.
8. In the search field try some search words for your topic. We used phone. This will help find data points related to your topic. Click the magnifying glass to search. (Yes, it might take a bit, it's a slow, but powerful, database)
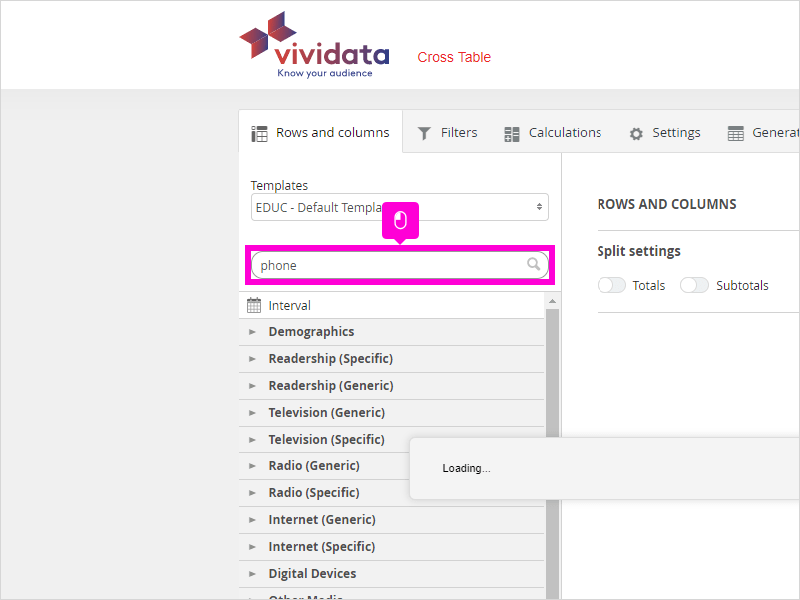
9. For our example we are looking under Digital Devices, you may use a different category. Click the category to expand it.
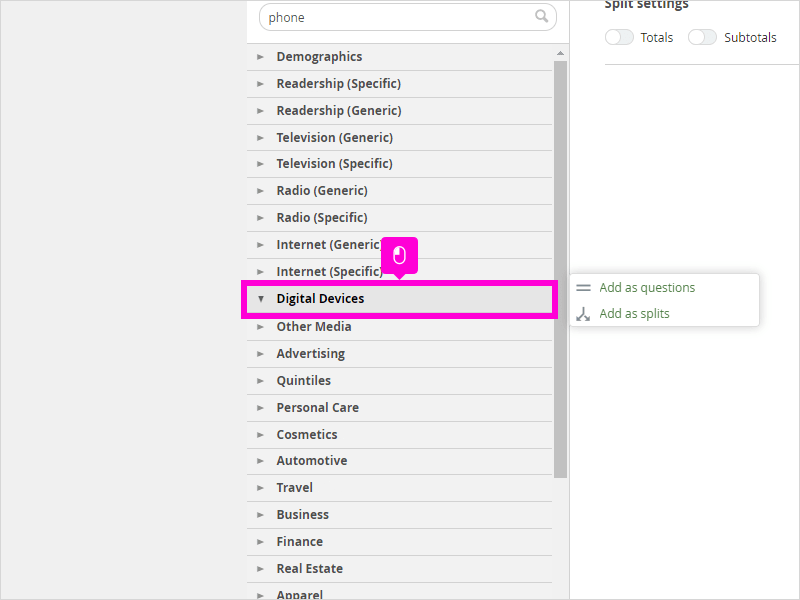
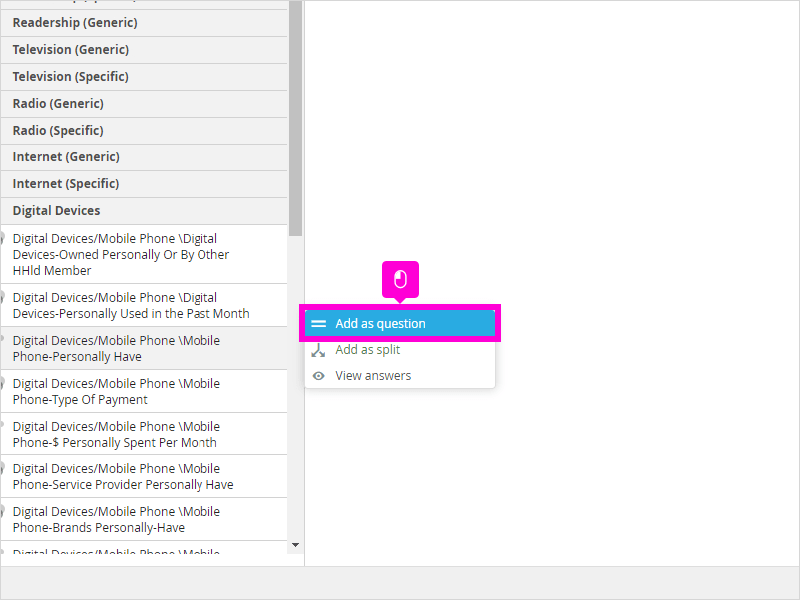
10. Browse through the data points to identify potentially useful ones. This may be personally have/where bought/how often and more, depending on your topic.
When you've identified a variable you'd like to use, hover over it and select Add as question.
11. Remove your search term now.
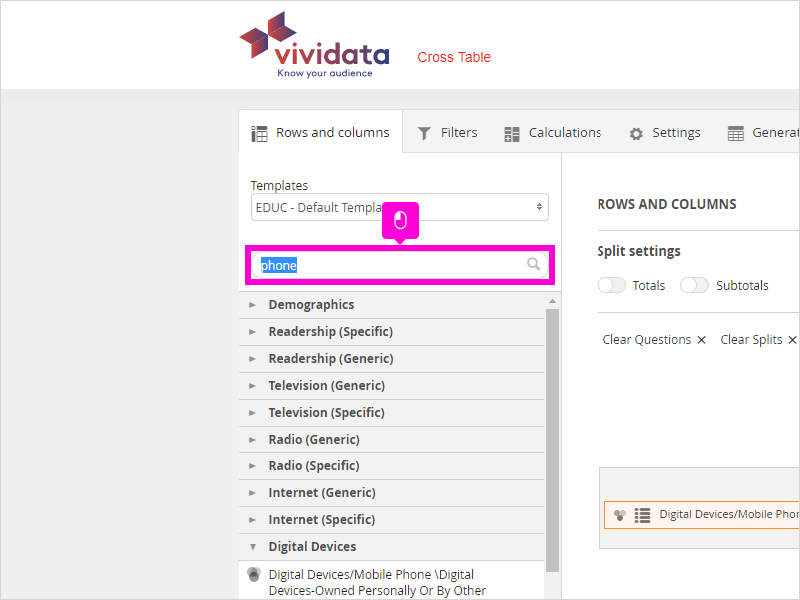
12. Click Demographics.
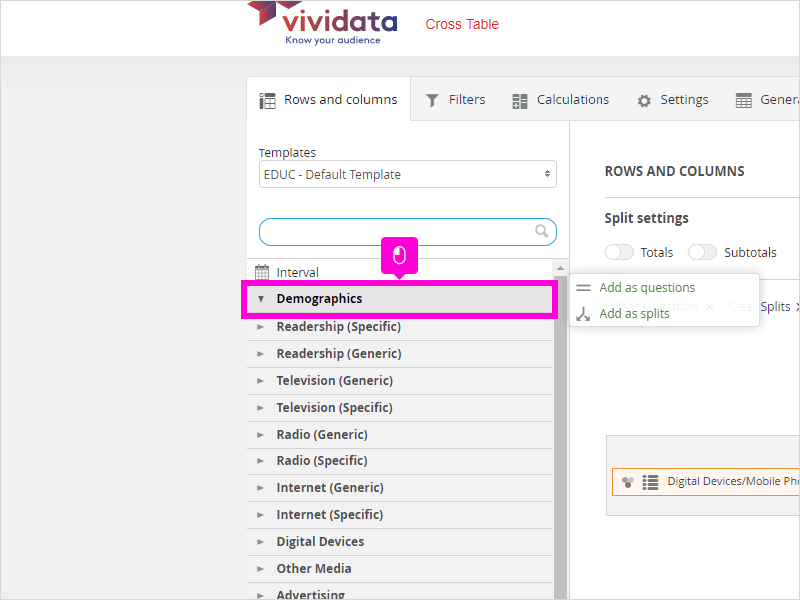
13. Identify how you would like the information displayed as. For example we want to know about people 14+. You may want to know about them based on income, location and more. Hover over the variable and click Add as split.

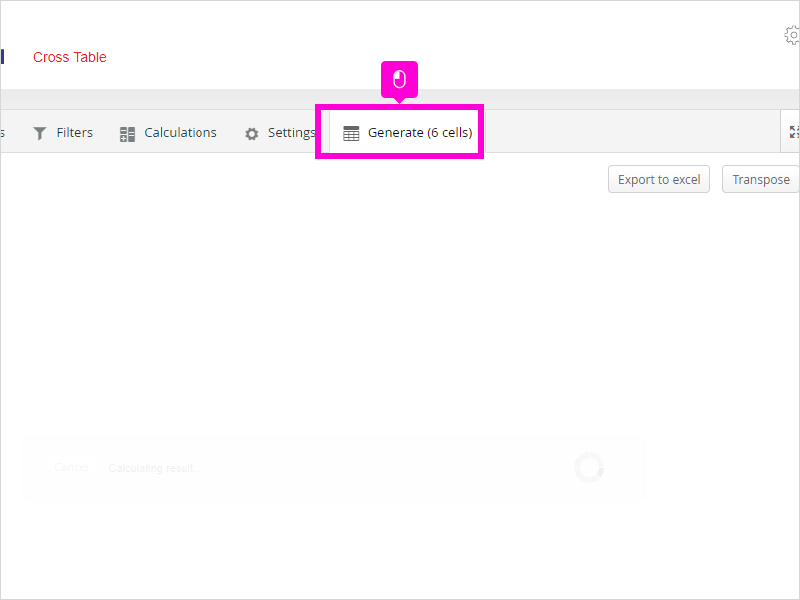
14. Click Generate.
15. That's it. You will now have information about your target audience.
Here's an interactive tutorial
https://www.iorad.com/player/1792327/Find-target-audience-information---Vividata
Statista's Consumer Insights tool allows users to view the results of an online survey about the attitudes and behaviors of consumers from various countries (including Canada).
Review Statista's instructions to learn how to use the Consumer Insights tool: Getting Started: Consumer Insights

Mintel
11 STEPS
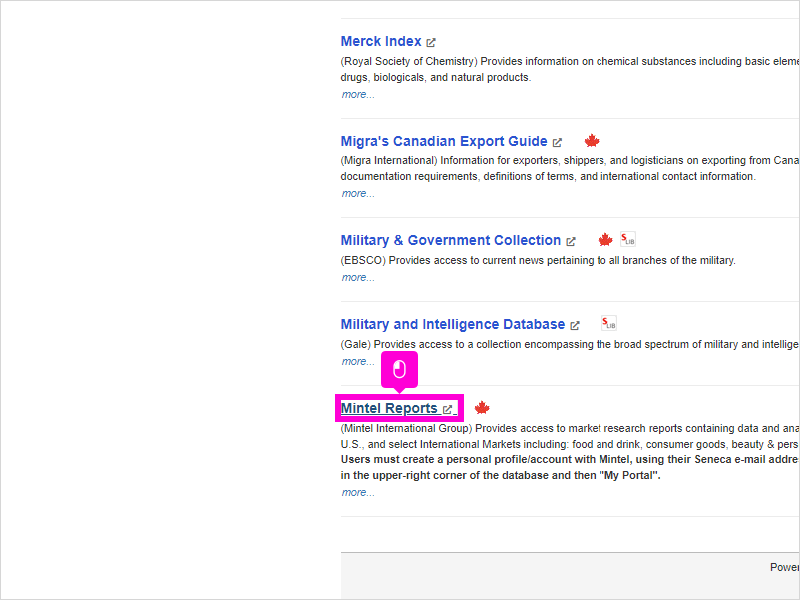
1. The first step is to open Seneca Libraries and click Databases A-Z
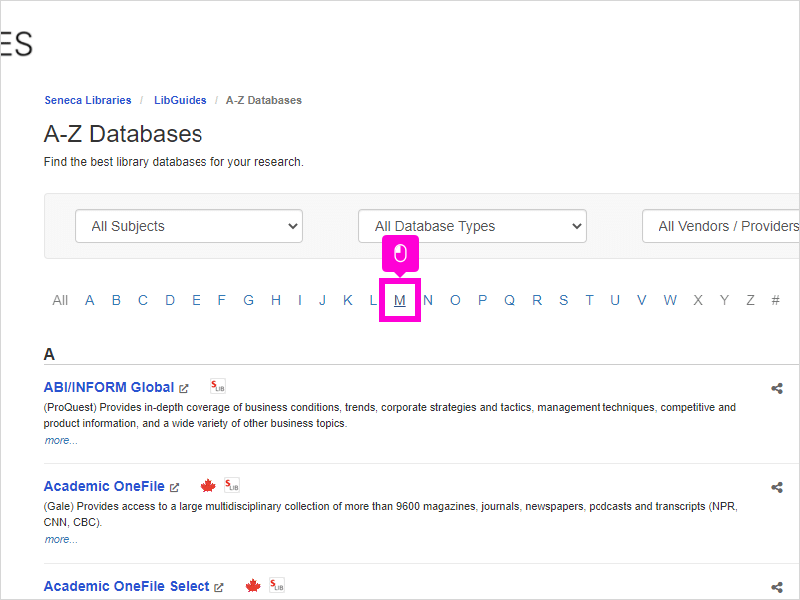
2. Click M
3. Scroll down and click Mintel Reports
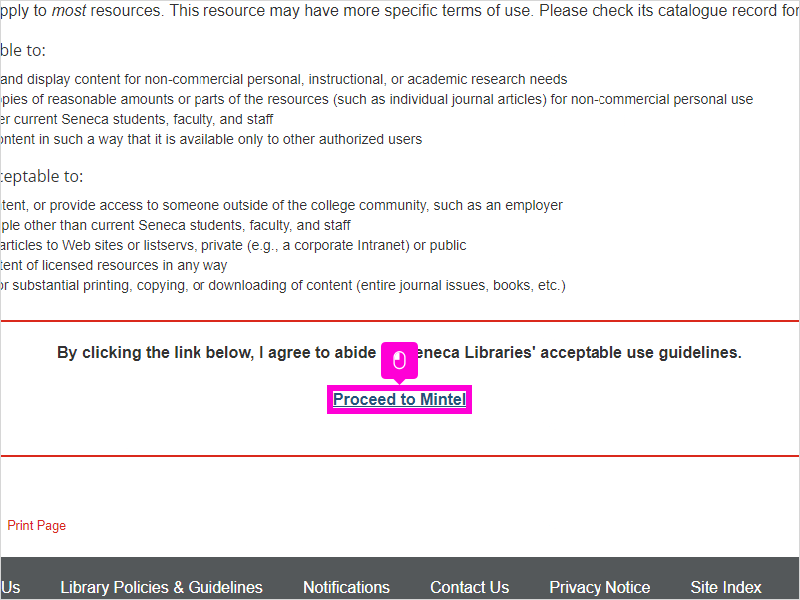
4. Click Proceed to Mintel and then follow the steps to log in
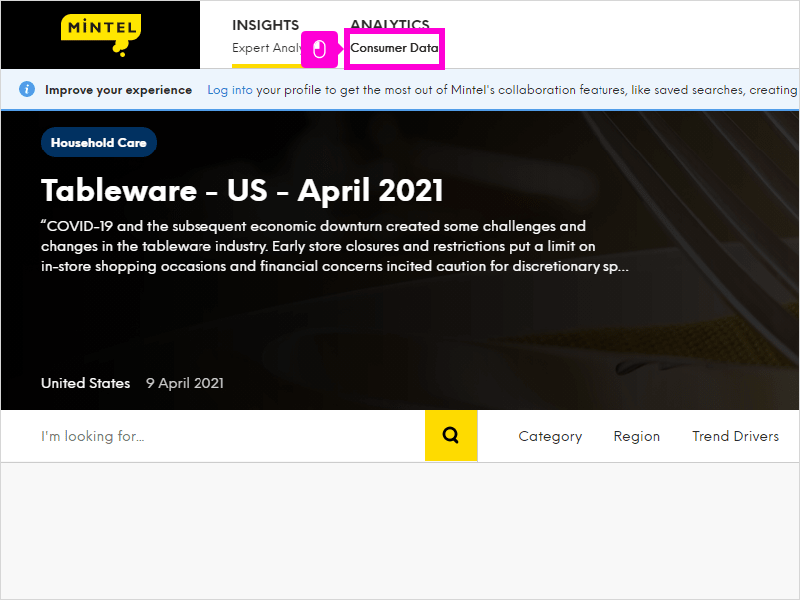
5. Click Consumer Data
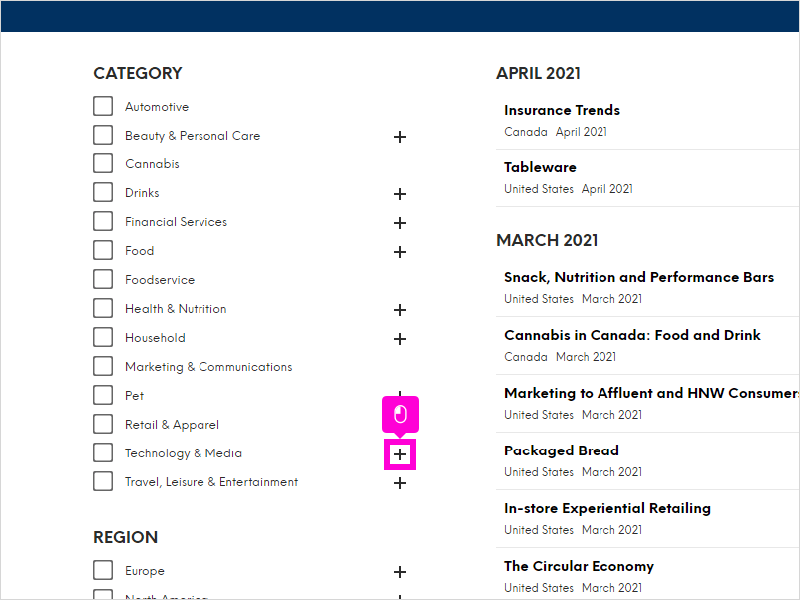
6. Browse through to find your relevant category, for our scenario we will look under Technology & Media
7. Then expand Technology
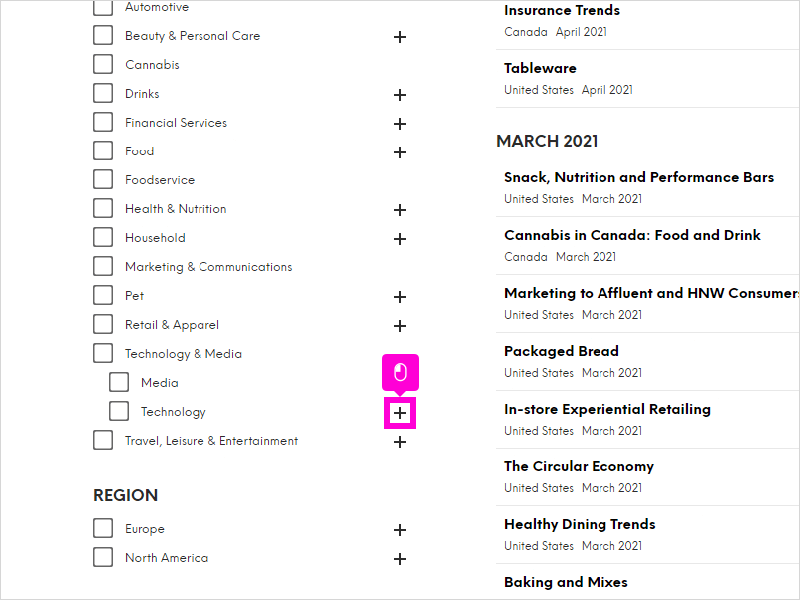
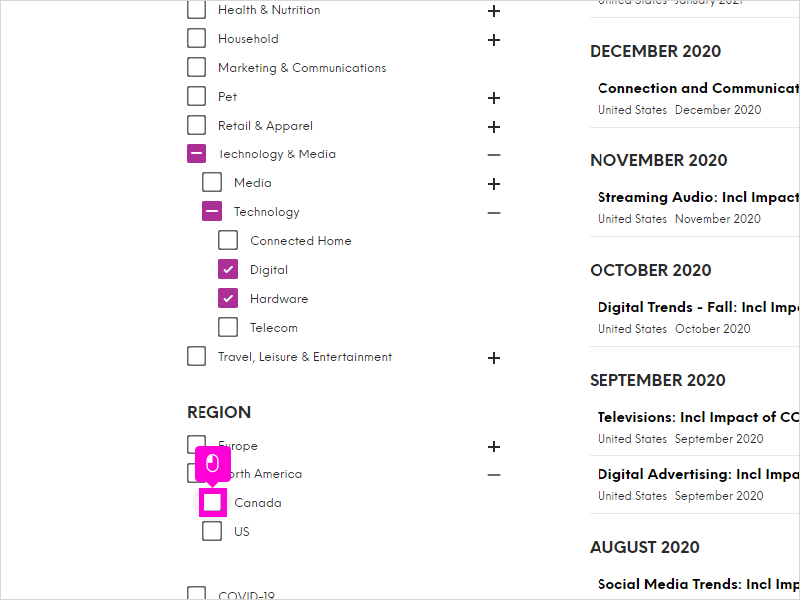
8. Then we will select Digital and Hardware as our product is related to these categories.
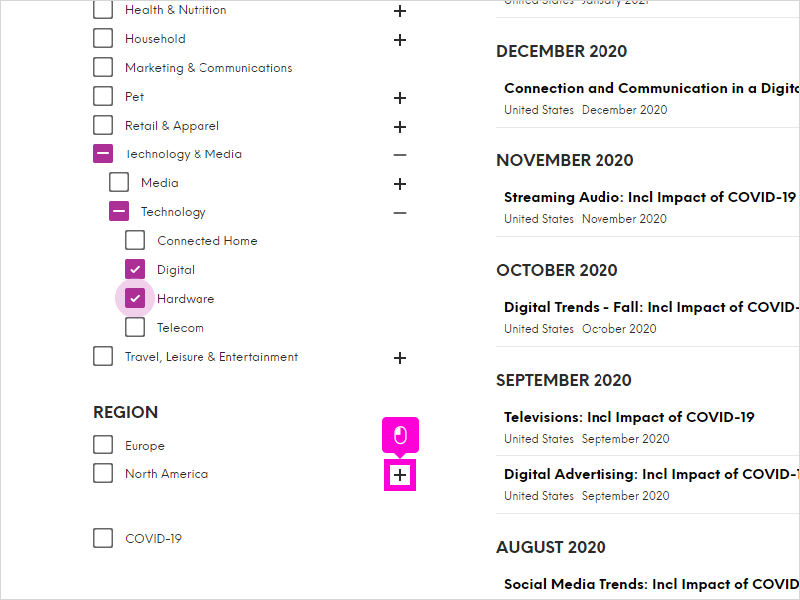
9. Scroll down under Region and expand North America to check off Canada
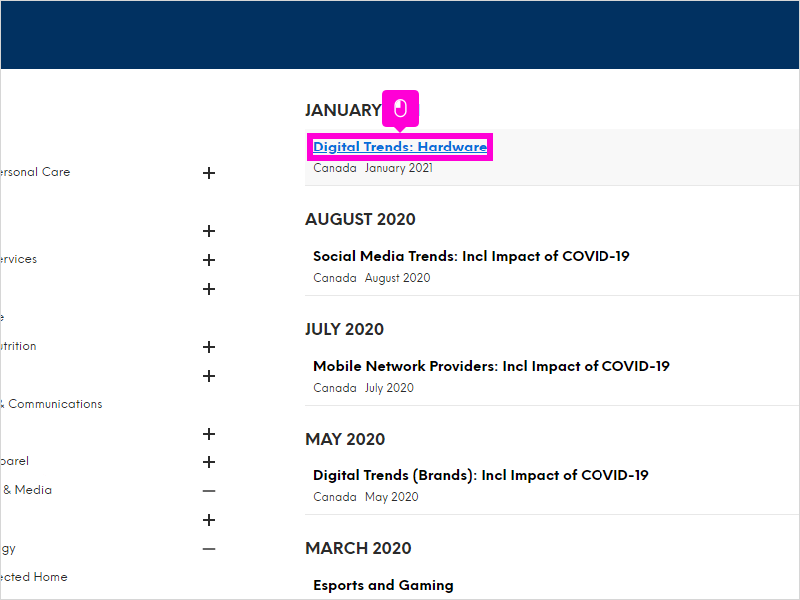
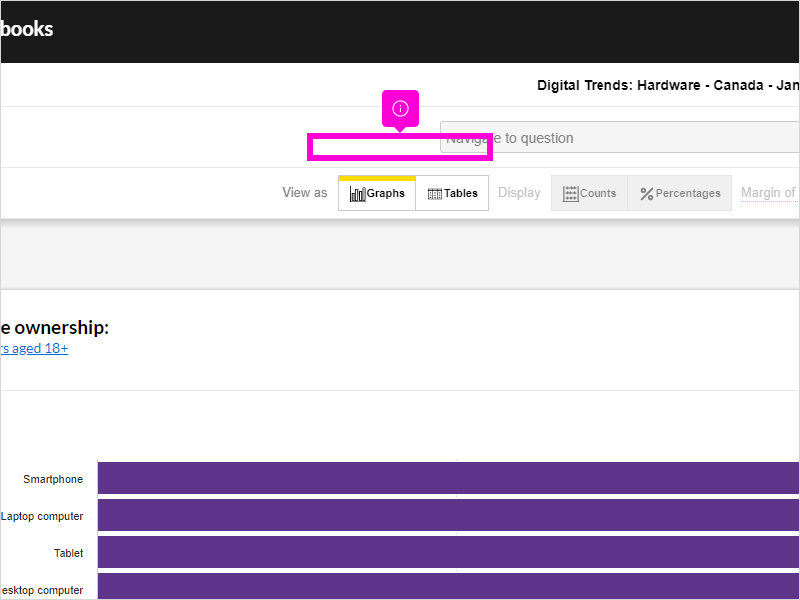
10. Browse the results for a data set that sounds promising for your topic. For our product we are going to try Digital Trends: Hardware
11. That's it. You're done. Browse the page for useful data or return to the previous step to explore a different data set.
Here's an interactive tutorial
https://www.iorad.com/player/1795402/How-to-Find-Consumer-Data-in-Mintel-Databooks
 This work is licensed under a Creative Commons Attribution-NonCommercial-ShareAlike 4.0 International License.